KING COUNTY, WASHINGTON · OCTOBER 20, 2026
Crash patterns, residents and workplaces.
Where did severe crashes increase—and what do commuting, job activity, roads and daylight add to the investigation?
- COMMUNITIES
- Seattle · Bellevue · Tukwila
- REPORTED CRASHES
- 2020–2024; increase focus 2021–2023
- FEDERAL CONTEXT
- ACS 2020–2024 five-year estimates
LODES 2023 primary jobs - RESEARCH EDITION
- CloudRaven Labs · Powered by TrendSights
THE QUESTION
A local pattern worth investigating.
A rise in severe crashes is a starting point for research. We wanted to see which roads and communities contributed to the change, whether an extra year changed the comparison, and what federal and local records could add.
Seattle and Bellevue provide the original comparison. Tukwila adds a useful contrast: a smaller resident population, many workplaces and a large share of reported crashes on state routes.
This is a descriptive research example developed with Codex and the TrendSights research approach, with human review. It is a locally assembled study, distinct from a hosted TrendSights research run.
WHAT WE FOUND
City streets, late-year changes and a workplace contrast.
Each observation points to something specific to investigate. None is a claim about what caused a crash.
85.7%
of the countywide net increase
City Street records account for most of the 2021–2023 increase.
King County recorded 161 additional fatal or suspected serious injury crash events across all road categories. City Street records account for 138 of that net increase. Seattle adds 80; Bellevue adds 1; the remaining source city labels add 57.
A share of a net count change, not a crash risk or a share of all crashes.
6 → 18
Bellevue severe crashes in Q4
Bellevue's late-2024 count deserves a closer look.
On City Street records, Bellevue's fourth-quarter severe count rose from 6 in 2023 to 18 in 2024. Total reported crashes in those quarters barely moved: 386 to 385. Seattle's annual severe City Street count fell from 259 to 207.
A specific exploratory signal. Small counts need uncertainty checks before interpreting significance.
4.23 : 1
Tukwila workplace / resident-held jobs
Residents alone leave out part of Tukwila's story.
LODES 2023 records 42,504 primary jobs at Tukwila workplaces and 10,044 primary jobs held by its residents. Meanwhile, 1,024 of its 1,464 reported crashes in 2023 (69.9%) were coded State Route. The city's road network and employment role both matter to the questions we ask.
Job links are context. They do not count daily arrivals, people passing through or traffic exposure.
235 / 271
Seattle modeled-night severe events
Nighttime does not automatically mean unlit roads.
Among Seattle's 271 severe City Street events at modeled night in 2021–2023, 235 were separately reported by SDOT as “Dark – Street Lights On.” That gives a researcher a more specific next question about crossings, visibility, movements and road design.
Modeled solar position and observed lighting are separate features. Neither establishes a cause.
A comparison detail matters: Seattle's matched intersection-related subset rose from 81 to 138 severe events (+57) in 2021–2023. Bellevue's +1 is its total City Street change; it is not a matched intersection comparison.
GEOGRAPHIC CONTEXT
Look at the same places in different ways.
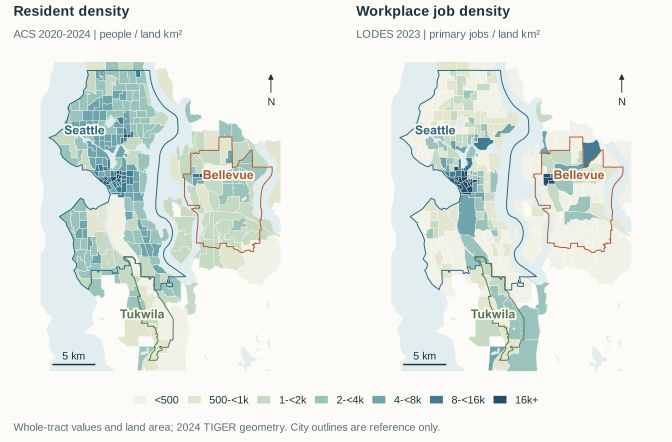
Inspect crash cells, resident density and workplace density. Select a cell or tract with the controls, or move over the map to read its values.
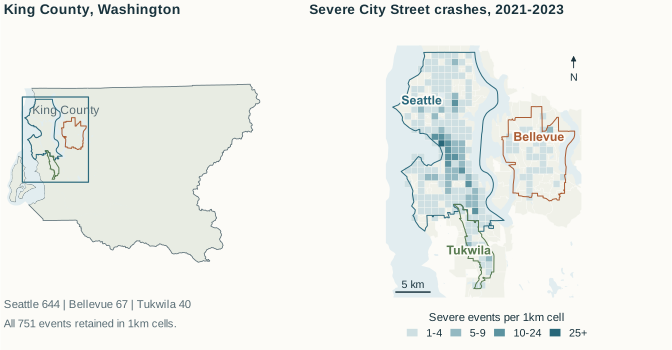
Severe City Street crashes · 2021–2023
Reference geography: Census TIGER 2024. Map sources: WSDOT and U.S. Census Bureau. Metric projection: UTM zone 10N. No individual crash points are shown.
SELECTED 1 KM CELL · 549-5273
28
Fatal or suspected serious injury crash events, 2021–2023. 751 events across the selected city cohort.
Cell shading: 1, 2–4, 5–9, 10+ events. City cohorts use WSDOT's source city labels. A cell can cross a city boundary; blank cells are not a measure of safety. The grid is descriptive, without a statistical hotspot test or travel denominator.
Download source GeoJSONEXPLORE THE DERIVATIVES
Change the comparison. Inspect the counts.
Switch cities, roads and time detail. For the Bellevue finding, choose 2023–2024 and Quarter, then compare the severe and all-reported measures.
Severe crashes · City Street · 2020-2024
1,179 crash events in this selection. Counts per event, without adjustment for travel.
Seattle: 983 total
Bellevue: 115 total
Tukwila: 81 total
Daylight at the time of severe crashes
The same city, road and year selection, grouped by modeled solar phase. Event shares describe when reported crashes occurred; travel volumes by time of day are still needed.
Seattle · 983 severe events
daylight: 503 (51.2%) · civil twilight: 46 (4.7%) · night: 432 (43.9%) · Unknown: 2 (0.2%)
Bellevue · 115 severe events
daylight: 74 (64.3%) · civil twilight: 9 (7.8%) · night: 32 (27.8%) · Unknown: 0 (0.0%)
Tukwila · 81 severe events
daylight: 43 (53.1%) · civil twilight: 6 (7.4%) · night: 32 (39.5%) · Unknown: 0 (0.0%)
NOAA approximate solar model, event coordinates and local date/time converted using America/Los_Angeles daylight-saving rules. Daylight ≥ −0.833°; civil twilight ≥ −6°; night below −6°. Unknown times stay in the denominator. This does not measure street lighting, weather or visibility.
FEDERAL + STATE + LOCAL
What Census context adds—and what it leaves open.
Resident commute patterns and workplace job concentration describe different parts of a community. Joining them makes the research questions more precise.
| Measure and universe | Seattle | Bellevue | Tukwila |
|---|---|---|---|
| Residents · ACS 2020–2024 | 754,195 ± 72 | 151,847 ± 87 | 21,451 ± 47 |
| Mean commute · minutes | 26.0 ± 0.3 | 23.6 ± 0.6 | 24.6 ± 1.2 |
| Work from home · % | 34.8 ± 0.7 | 35.6 ± 1.4 | 12.8 ± 3.6 |
| Workplace primary jobs · 2023 | 613,163 | 149,690 | 42,504 |
| Primary jobs held by residents · 2023 | 368,224 | 71,279 | 10,044 |
| Workplace / resident-held job balance | 1.67 : 1 | 2.10 : 1 | 4.23 : 1 |
ACS estimates ± 90% margins of error. Commute time: resident workers age 16+ who do not work at home. Home-working share: all resident workers age 16+; share margins are percentage points. LODES 2023 JT01 primary jobs are home/work relationships with disclosure protection; no ACS-style MOE is supplied for job counts.
Why look at jobs?
Tukwila's workplace job density is close to Bellevue's, while its resident density is lower. In LODES, 98.2% of its workplace primary jobs link to homes outside the city. That is a reason to measure travel into and through the city more carefully.
Why keep traffic counts separate?
A dated I-5 section in Tukwila reports annual average daily traffic of 239,000 vehicles in 2023. It measures a road section, not unique people. Census jobs do not count daily attendance or passing traffic. Neither measure alone supplies a citywide crash-risk denominator.
THE PUBLISHED ARTIFACTS
Read the research without leaving the page.
Browse the carousel, brief, evidence atlas and design guide. Each view uses the final page renders; open the original PDF for vector artwork and clickable citations.
Published October 20, 2026 on the CloudRaven Labs LinkedIn page, with a four-image X research thread.
The social posts preserve the October 20 edition. The controls on this page explore derivatives of the same frozen records; they are not a live crash-data feed.
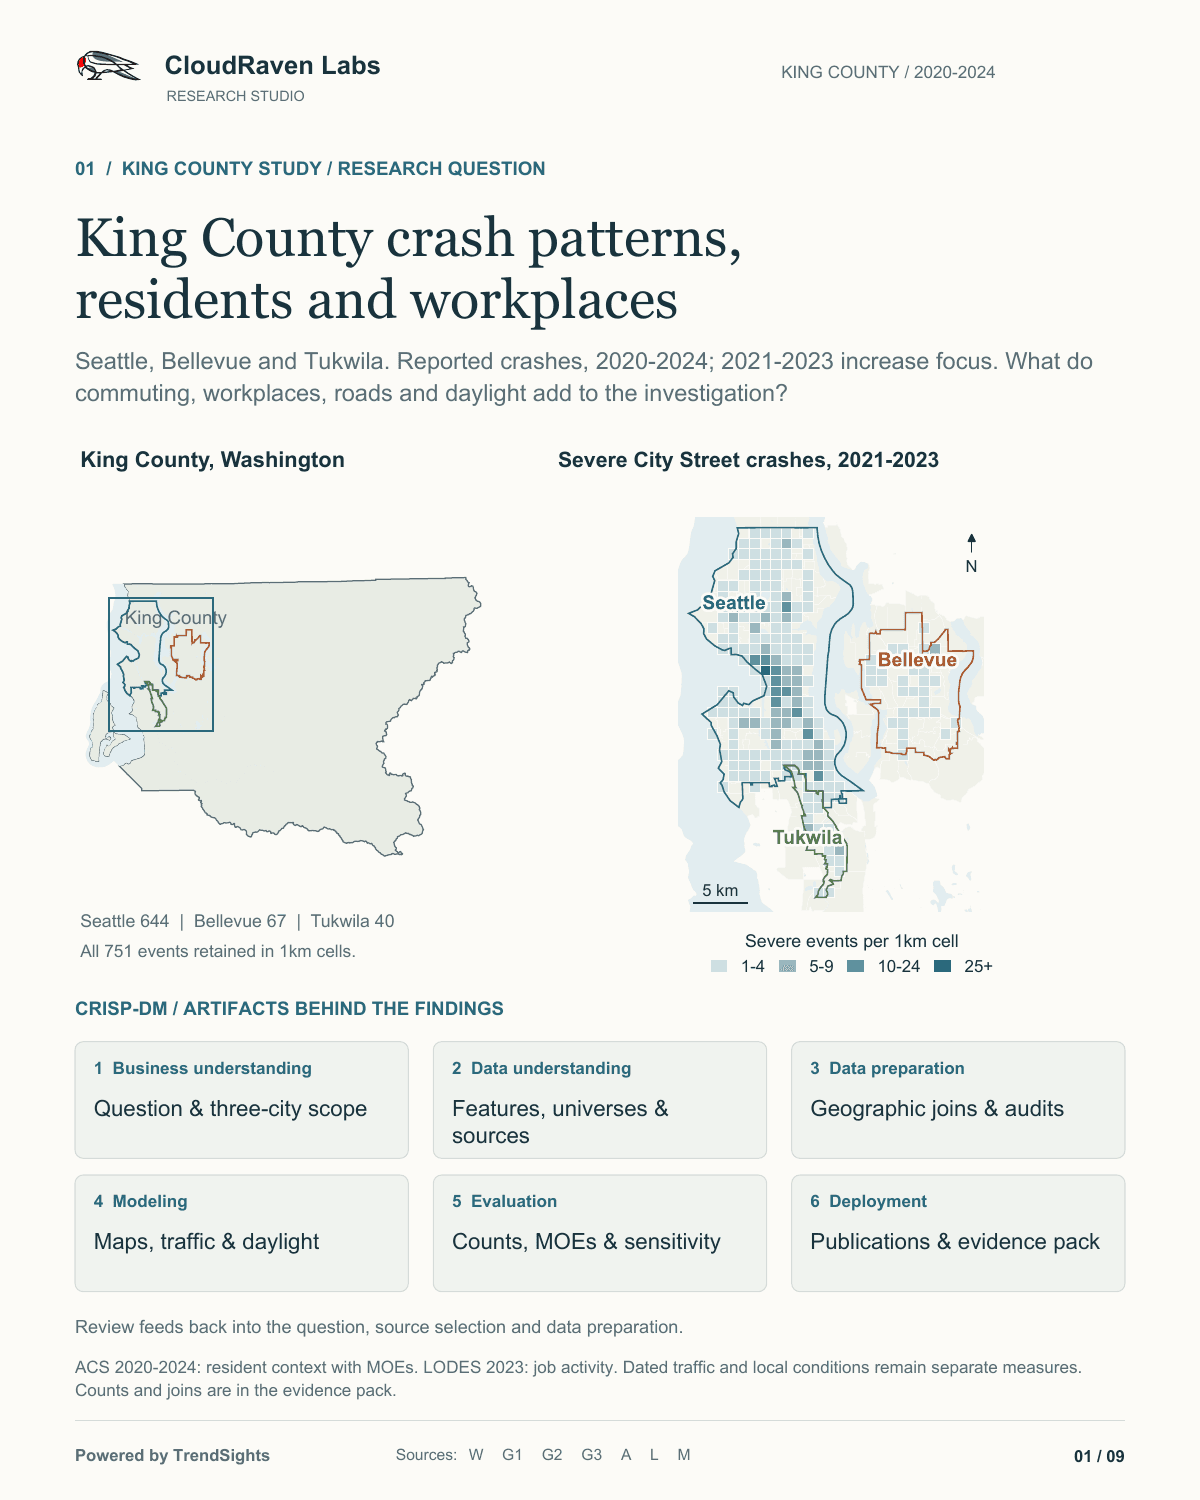
Page 1 of 9
October 20, 2026 edition. These are the final publication pages. The original PDFs retain vector maps, charts and source links.
RESEARCH PROCESS · CRISP-DM
Follow the question through the work.
The process leaves inspectable outputs at each stage. Researchers can revisit a join, question a definition or add the next missing source.
01
Business understanding
Define the community question, intended audience and comparison. Keep the full 2020–2024 series separate from the 2021–2023 increase focus.
Research brief02
Data understanding
Inspect source units, severity definitions, road categories, dates, geography and the different populations each measure describes.
Source ledger03
Data preparation
Join official geographic keys, preserve uncertainty and unknowns, and audit local collision matches rather than assuming records line up.
Join plan04
Modeling
Compare descriptive time series and spatial aggregates; derive solar conditions using a documented astronomical model.
Solar method and audit05
Evaluation
Reconcile totals, check source hashes, inspect maps and labels, and assess what the observations can and cannot support.
Evidence verification06
Deployment
Publish a reviewed research edition with downloadable reports, source tables and open questions that other researchers can build on.
Publication record
SOURCES, DEFINITIONS AND LIMITS
Keep the evidence attached.
Download the aggregates, inspect the joins and keep the measurement limits with any reuse.
Reuse the data
- Crash counts by city, road and year
CSV · three-city annual series
- Crash timing and modeled solar phase
CSV · city, road, month, hour and solar phase
- Resident and workplace context
CSV · estimates, MOEs, universes and job measures
- ACS estimates and annotations
CSV · estimate / MOE / annotation cells
- Tract crash and Census joins
CSV · whole-tract context and reported crash aggregates
- Matched highway traffic sections
CSV · dated AADT comparisons and section keys
What “severe” means
Fatal or suspected serious maximum injury per reported crash event. Events are not injured people. The frozen WSDOT outcomes were retrieved October 9, 2026; later municipal extracts add attributes without replacing that outcome series.
What remains unmeasured
Comparable all-road travel exposure; road-user movements and volumes by time; comparable observed lighting and weather outside Seattle; and historical patrol duty hours across the cities. No significance, causal, intervention-effect or validated forecast claim is made here.
Time and geography
Crash year, ACS five-year period and LODES job year have different roles. ACS context repeated across crash years is not an annual exposure series. Official block-parent crosswalks and 2024-reference tract geometry align the joins; whole-tract attributes do not describe an individual crash participant.
TRENDSIGHTS AT THE TOP AI SPRINT SHOWCASE
From a local question to reusable evidence.
CloudRaven Labs is preparing to share TrendSights at the October 23, 2026 TOP AI Sprint Showcase, part of The Opportunity Project's work on preparing federal open data for the next generation of AI users.
The public demo follows community research through maps, Census context, sources and reusable artifacts. This King County case study adds a detailed federal, state and local research example. The showcase itself is an invite-only virtual event.
What should we measure next?
Intersection movements, crossing patterns and comparable travel volumes would help turn these patterns into sharper questions. The evidence is here so community researchers can inspect, challenge and build on it.
 A CloudRaven Labs research example