Understand communities. Support better decisions.
TrendSights
Community-level research.
In Less time.
TrendSights is an AI-assisted research workspace for understanding communities. Explore public data, compare places through supported workflows, and create maps, notebooks and briefs with sources and methods attached.
For community researchers and analysts supporting planning and program decisions.
Map output · A worked King County example
See the place behind the numbers.
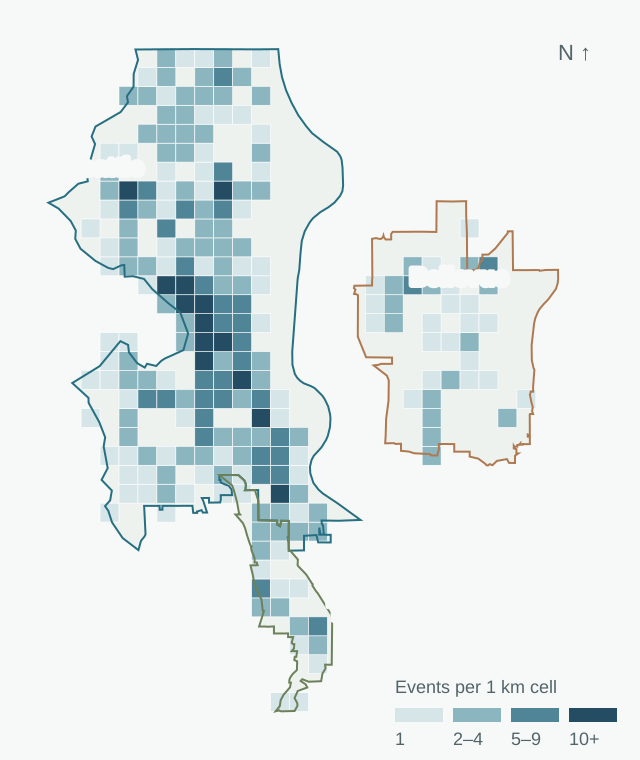
Example finding · Seattle
Severe City Street crashes
179
2021
259
2023
+80 reported crashes
A starting point for investigating local conditions, not an explanation of cause.
WSDOT records · 2021–2023 · Three-city study in King County. Counts are not adjusted for travel exposure.
Inspect the map and sourcesDefine a question and place
Start with the decision you need to support. Set the geography, period and measures that make the question answerable.
Explore supported public data
Work with available sources and workflows. Keep definitions, coverage and uncertainty visible as you explore.
Review and share results
Inspect the findings and limits, then use maps, notebooks and briefs to help colleagues follow the evidence.
A recorded introduction · TOP Sprint 2026
Meet TrendSights in 2:18
Rob Schaper · Tech Team Lead, TOP Sprint 2026
See how a research question connects to public data, maps and portable research files, with sources, methods and human review kept visible.
Prepared for U.S. Census Open Innovation Labs, this recorded development demonstration follows a saved community study and the evidence behind its outputs.
From analysis to an answer others can inspect
Explore the research outputs TrendSights supports.
Make community evidence easier to understand, check and reuse. Explore maps, notebooks and briefs, then see how reviewed work can be presented in a publication. The examples come from CloudRaven’s King County study.
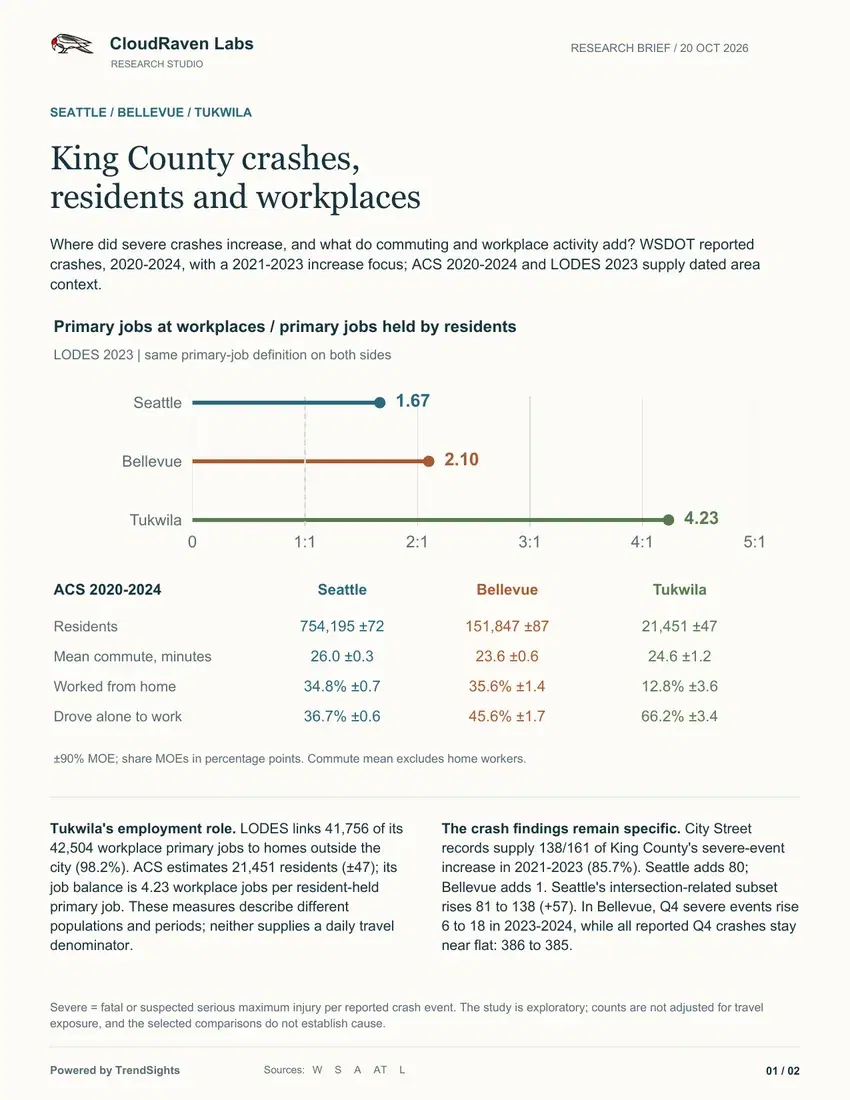
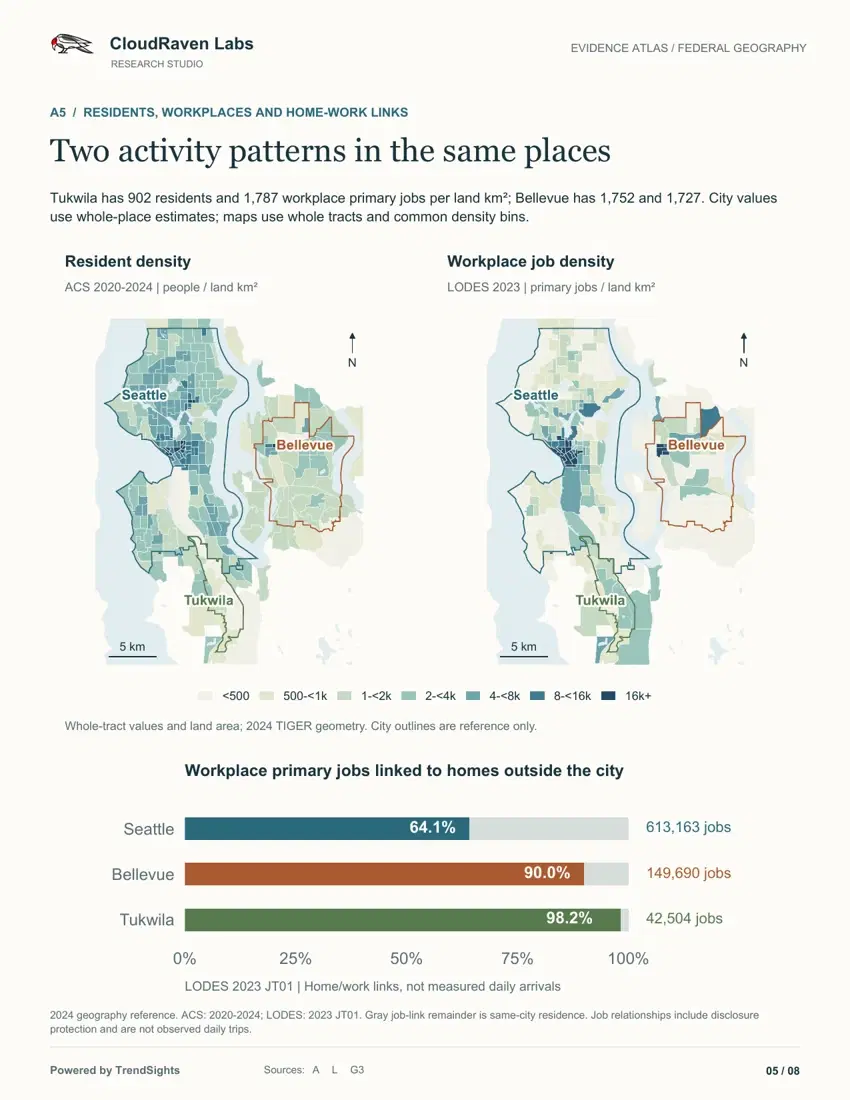
Maps · Place and context
See how the evidence varies by place.
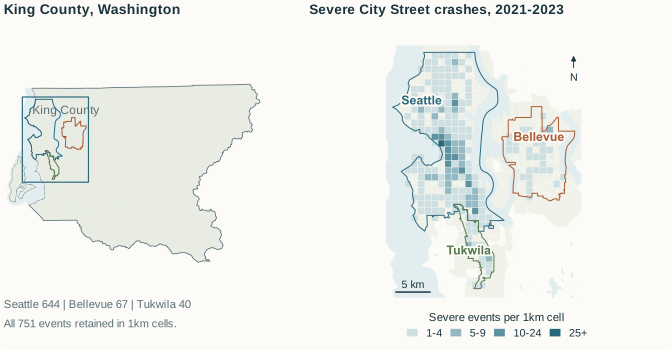
Maps help you compare places and understand the geography behind a finding. In this King County example, resident and workplace maps add context to the crash question across Seattle, Bellevue and Tukwila.
Maps with their source context
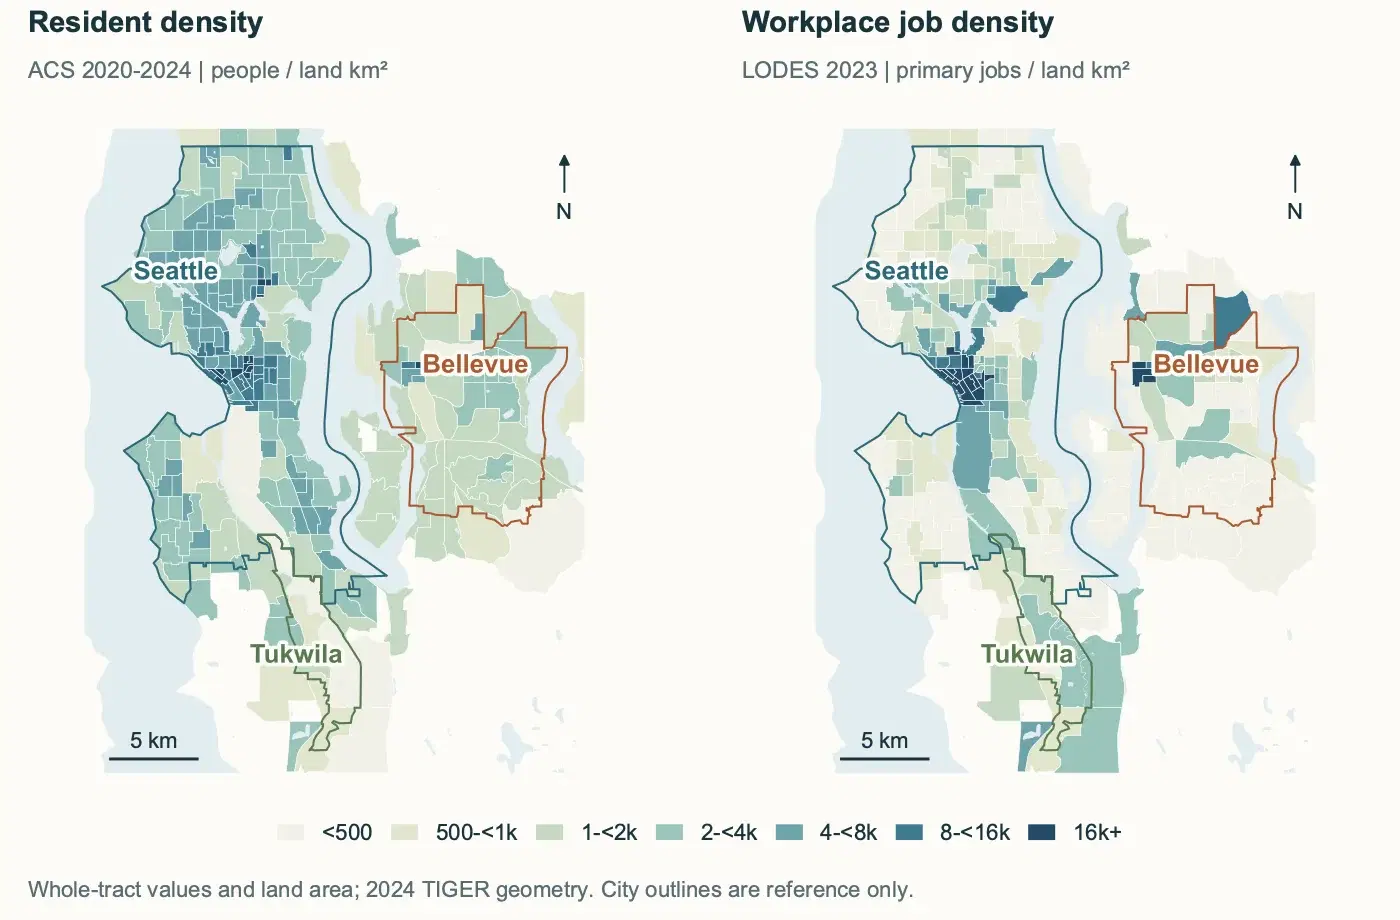
Locally developed CloudRaven publications and a reproducibility notebook from the published study tables illustrate these output types and the publication experience shown here. Available outputs depend on the supported workflow; the complete study was developed separately from hosted TrendSights runs.
A worked research example · King County, Washington
What do roads, residents and workplaces add to a crash study?
Community research often needs more than one source to explain a pattern. CloudRaven combined crash records, Census resident data and workplace context across Seattle, Bellevue and Tukwila to illustrate the kinds of research outputs TrendSights supports.
Start with the rise in severe city-street crashes, then inspect the maps, source definitions and published findings. Change the city, road category and time detail to see what the evidence can support.
Crashes: 2020–2024 · Increase focus: 2021–2023
ACS: 2020–2024 · Primary jobs: 2023 · Updated October 20, 2026
A method you can follow
Keep the question, data and findings connected.
TrendSights organizes research around CRISP-DM, a six-stage process for moving from a question to reviewed results. See what each stage contributes, illustrated by CloudRaven’s King County study.
01 · Business Understanding
Define what you need to know.
Define the community question, places, period and intended use before choosing data or methods.
King County example: severe city-street crashes in Seattle, Bellevue and Tukwila, focused on 2021–2023.
- What you carry forward
- A clear question and a bounded research scope.
Revisit earlier stages as evidence changes. The locally developed King County artifacts illustrate the CRISP-DM process; a researcher reviews findings before use.
Another way to begin · Private plugin beta
Already use Codex? Start your question there.
TrendSights Research skills offer Codex users an additional entry path: scope a community question, identify sources and choose a supported research workflow.
Use the TrendSights workspace to inspect the available results and artifacts. Review sources, methods and limitations before sharing the work with colleagues.
- 01Scope the question in Codex.
- 02Choose an available research workflow.
- 03Review and share the resulting work.
Beta access is reviewed. Ask about plugin availability and supported workflows for your setup.
TrendSights Research · Plugin configuration preview

King County research notebook
Python · Executed exampleQuestion
Where did severe crashes increase?
Seattle, Bellevue and Tukwila · City Street · 2021–2023
In [2] · Python excerpt
summary = [
    {"city": city, "start": annual[city, 2021], "end": annual[city, 2023],
     "change": annual[city, 2023] - annual[city, 2021], "total": totals[city]}
    for city in cities
]
Executed output · Severe crash counts
| City | 2021 | 2023 | Change |
|---|---|---|---|
| Seattle | 179 | 259 | +80 |
| Bellevue | 20 | 21 | +1 |
| Tukwila | 12 | 14 | +2 |
Reconciles all 751 mapped events. Counts describe reported crashes, not travel-adjusted risk.
Your next research question
Bring your community question to TrendSights.
Request a private beta workspace for your research. Create and verify your account, share your research needs, and have your access request reviewed. Account creation and workspace approval are separate steps.
Research perspective · 4 min read
How CRISP-DM Could Help Community Researchers Manage Insight Fatigue
Agentic research can generate findings faster than people can review them. CRISP-DM could help community researchers keep the question, evidence and next action connected.
Read the article